Note
Click here to download the full example code
Tutorial 2: Types of Surfaces
This tutorial covers what types of surfaces that can be plotted with
surfplot.
Types of surfaces
Put briefly, surfplot can take file paths to any valid surface file(s)
with geometry data. Under the hood, Plot runs
brainspace.mesh.mesh_io.read_surface() to load files. Typically, these
will be Freesurfer or GIFTI files.
plottingPlot can also read instances of
brainspace.vtk_interface.wrappers.data_object.BSPolyData, which are
returned by read_surface(). So, pre-loaded surfaces with
read_surface() can be plotted as well.
Beyond that, surfplot is invariant to the actual brain surfaces you wish
to use. Common human surfaces include fsaverage surfaces packaged with
Freesurfer, and Human Connectome Project fsLR surfaces (downloadable here). Several different
human surfaces can also all be found on OSF here.
Non-human surfaces can also be plotted, such as the NMTv2 Macaque surfaces.
Note that throughout these tutorials, surfaces are automatically fetched using
neuromaps or Brainspace to avoid having to specify local files. It
is also possible to fetch fsaverage surfaces
using nilearn. These are all great options to automically get surfaces in
your workflow, and make reproducibility and portability of your code a bit
more feasible.
Note
Make sure to always use the correct surface for your data. Double check the number of vertices in both your data and the surfaces you are using for plotting.
In Tutorial 1: Quick Start we plotted fsLR
surfaces. For the sake of demonstration, let’s plot Freesurfer’s fsaverage
here, again using neuromaps fetching functions.
from neuromaps.datasets import fetch_fsaverage
from surfplot import Plot

surfaces = fetch_fsaverage(density='164k')
lh, rh = surfaces['inflated']

# make figure
p = Plot(lh, rh)
fig = p.build()
fig.show()
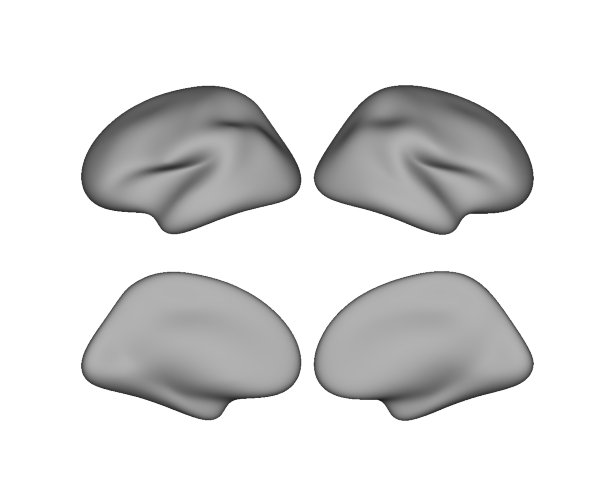
Brightness
By default, Plot will plot a medium-gray surface,
typical of most surface plotting packages like Connectome Workbench. The
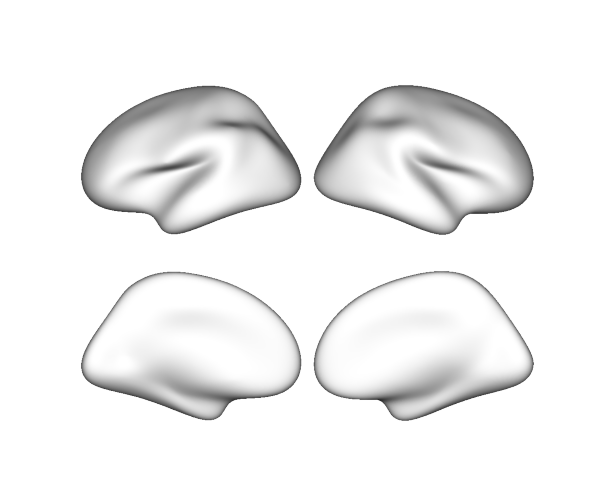
brightness of the blank surface can be adjusted using the brightness
parameter, if desired. Values range from 0 (black) to 1 (white). For example:
p = Plot(lh, rh, brightness=.8)
fig = p.build()
fig.show()
Total running time of the script: ( 0 minutes 0.584 seconds)