Note
Click here to download the full example code
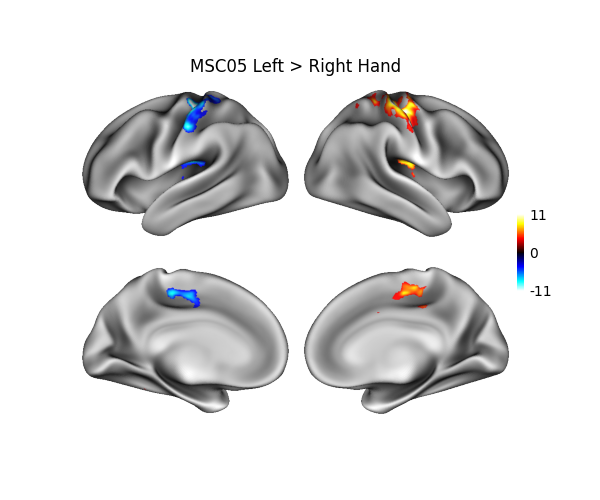
Example 2: Plotting volumetric data
This example shows how to project data from a NIFTI volume onto a surface, and then display the result.
Data is a Left vs Right hand localizer contrast (t-map) for a single subject
of the Midnight Scan Club dataset 1. Data is obtained from
Neurovault via nilearn and then
projected from MNI152 coordinates to fsLR surfaces using neuromaps.
- 1
Gordon EM, et al. 2017. Precision Functional Mapping of Individual Human Brains. Neuron. 95:791–807.e7.
# Code source: Dan Gale
# License: BSD 3 clause

from nilearn.datasets import fetch_neurovault_ids
from nilearn.plotting.cm import _cmap_d as nilearn_cmaps
from neuromaps.transforms import mni152_to_fslr
from neuromaps.datasets import fetch_fslr
from surfplot import Plot
from surfplot.utils import threshold

data = fetch_neurovault_ids(image_ids=[47307], verbose=0)
img = data['images'][0]

# project from MNI to fslr; GIFTI surfaces are returned
gii_lh, gii_rh = mni152_to_fslr(img)

# threshold after projection to avoid interpolation artefacts
data_lh = threshold(gii_lh.agg_data(), 3)
data_rh = threshold(gii_rh.agg_data(), 3)

# get surfaces + sulc maps
surfaces = fetch_fslr()
lh, rh = surfaces['inflated']
sulc_lh, sulc_rh = surfaces['sulc']

p = Plot(lh, rh)
p.add_layer({'left': sulc_lh, 'right': sulc_rh}, cmap='binary_r', cbar=False)

# cold_hot is a common diverging colormap for neuroimaging
cmap = nilearn_cmaps['cold_hot']
p.add_layer({'left': data_lh, 'right': data_rh}, cmap=cmap,
            color_range=(-11, 11))

# make a nice vertical colorbar on the right side of the figure
kws = dict(location='right', draw_border=False, aspect=10, shrink=.2,
           decimals=0, pad=0)
fig = p.build(cbar_kws=kws)
fig.axes[0].set_title('MSC05 Left > Right Hand', pad=-3)
fig.show()
Total running time of the script: ( 0 minutes 0.318 seconds)